
We track our strategic progress against a number of financial and non-financial KPIs, and report our progress annually.
These Key Performance Indicators align to our strategic priorities.

We track our strategic progress against a number of financial and non-financial KPIs, and report our progress annually.
These Key Performance Indicators align to our strategic priorities.
How we measure it
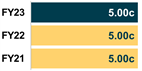
Dividends paid to Shareholders and declared in relation to the period.
Our progress in FY23
Our aim is to pay an attractive and progressive dividend, with a minimum payout of 85% of Adjusted Earnings. While keeping the dividend per share unchanged from the prior year, the earnings growth from the business supported the dividend being fully covered for the year.
How we measure it
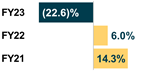
Total Return (TR) measures the change in the EPRA Net Tangible Assets (EPRA NTA) over the period plus dividends paid.
Our progress in FY23
The return calculated from the dividends paid has been more than offset by the decline in valuation, which was driven by inflation and the resulting impacts on interest rates.
How we measure it
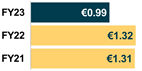
Net asset value in IFRS GAAP.
Our progress in FY23
Inflation and the resulting impacts on interest rates have been the key drivers of this valuation movement, which could not be fully offset by strong market rental growth and indexation.
How we measure it
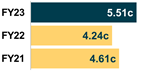
EPRA earnings, adjusted to include licence fees and rental guarantees receivable on forward funded development assets and for other earnings not supported by cash flows.
Our progress in FY23
Adjusted Earnings increased by 30% in the year, reflecting the full-year impact on rental income from acquisitions in the prior year and a 10% decrease in administrative expenses.
How we measure it
The proportion of our gross asset value that is funded by net borrowings (excluding cash).
Our progress in FY23
The lower portfolio valuation, ongoing capital expenditure and working capital movements largely offset the benefit of the sales proceeds from the disposal programme. The Company remains comfortably below the LTV ratio covenant of 65%. (Including the disposals of Bochum and Malmö in November 2023, the pro forma LTV is 44.0%.)
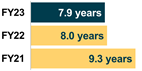
How we measure it
The portfolio average of the remaining number of years, weighted by annual passing rents, until the sooner of the lease expiry or the customer’s break option.
Our progress in FY23
The Company has maintained a WAULT of greater than five years across the portfolio, in accordance with typical lease lengths in Continental Europe. The WAULT to expiry is 9.6 years
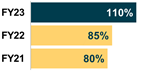
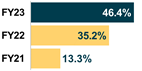
How we measure it
Adjusted Earnings as a proportion of the dividend declared for the financial period.
Our progress in FY23
The 30% growth in Adjusted Earnings, combined with maintaining a dividend per share of 5.00 cents, drove an increase in dividend cover to 110.2%.
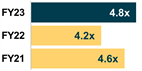
How we measure it
The ratio of consolidated earnings before interest and taxation to consolidated net finance costs in respect of any measurement period. The definition, and calculation method, of interest cover ratio has changed during the year aligning banking covenants and reporting. More details on the calculation are on p.144 of the Annual report. Comparatives for FY22 and FY21 were 6.6x and 6.3x using the previous definition.
Our progress in FY23
The Company remains comfortably above its interest cover ratio covenant of 1.5x.
How we measure it
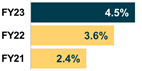
Like-for-like rental growth (excluding extensions; including extensions: 7.8%) compares the growth of the rental income of the portfolio that has been consistently in operation and not under development during the two full preceding periods. The definition, and calculation method, of like-for-like growth has changed during the year, moving to be in line with the industry standard definition, which excludes extensions.
The definition, and calculation method, of like-for-like growth has changed during the year, moving to be in line with the industry standard definition, which excludes extensions. The comparative for FY22 using the previous basis was 4.0%. There were no extensions in FY21.
Our progress in FY23
Solid rental growth in the period was driven by our asset management initiatives and indexation.